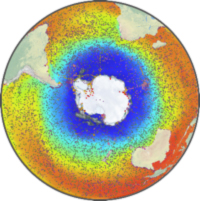
 SOOSmap gives you access to data from key circumpolar research programmes. In SOOSmap, you can explore temporal, spatial, and thematic distributions of observing platforms. These platforms include Argo floats, MEOP seals, continuous plankton recorder tows, tide gauges. For data types that are not yet fully standardised and aggregated, like the SOOS Mooring Network, SOOSmap provides links to the data centres that hold the data from each of the platforms. The observing platforms are given context by a series of base layers, including CCAMLR regions, sea surface temperature, and sea-ice concentration.
Using the spatial selection tools, you can download data from many platforms at once, while search tools in the left facet will allow you to explore spatial and temporal patterns in sampling of the Southern Ocean, which can help you plan future sampling programmes.
SOOSmap is a collaboration between the Southern Ocean Observing System (SOOS) and the European Marine Observation and Data Network (EMODnet) Physics group. It uses the EMODnet data servers to collate and publish the data, and SOOS’ network of scientists and data managers to coordinate the data flows.
SOOS is a body of SCAR and SCOR (Scientific Committee on Oceanic Research), which is tasked with facilitating the collection and delivery of essential observations on dynamics and change of Southern Ocean systems to all international stakeholders (researchers, governments, industries), through design, advocacy and implementation of cost-effective observing and data delivery systems.
For more information, and to use the product, visit SOOSmap on the SOOS website.
New data layers are being added to SOOSmap in coming months, so if your favourite data type is not in there yet, please contact the SOOS data officer to talk about how to get it added.
